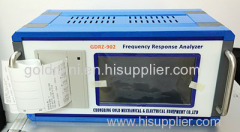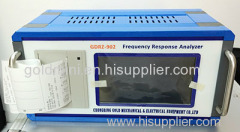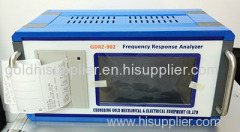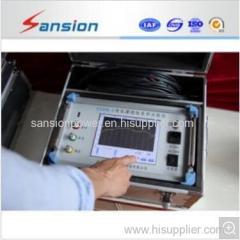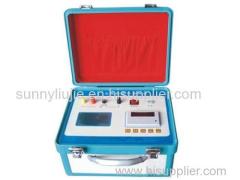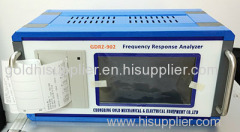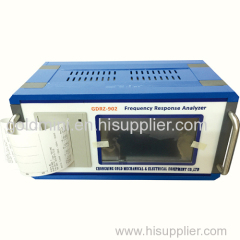
Automatic Transformer Frequency Response Analyzer
| Min. Order: | 1 Set/Sets |
|---|---|
| Trade Term: | FOB |
| Payment Terms: | L/C, T/T, WU |
| Supply Ability: | 500Sets/per Month |
| Place of Origin: | Chongqing |
Company Profile
| Location: | Chongqing, China (Mainland) |
|---|---|
| Business Type: | Manufacturer, Trading Company |
Product Detail
| Model No.: | GDRZ-902 |
|---|---|
| Means of Transport: | Ocean, Air, Land |
| Brand Name: | GOLD |
| Analyzer: | r Frequency Response Analyzer |
| Transformer Analyzer: | Automatic Transformer Frequency Response Analyzer |
| Production Capacity: | 500Sets/per Month |
| Packing: | Wooden Case |
| Delivery Date: | 10days |
Product Description
I.Introduction
The structure and reference of the transformer is fixed after been made, Therefor, the frequency response of each winding will be almost the same normally.
Some case such as cut off between circles or phases in experience, cut off or winding moved for the pull of power in running, winding moved for hit in transportation, could change the reference of the transformer ,of which the frequency response will be changed, we could detect the deformation according to the frequency response curve.
Our company has designed the winding deformation tester base on the idea and the advanced technique. It could draw the frequency response curve accurately. Then we compare the curves horizontally or vertically to detect the deformation of the transformer.
- III.Technical Data
II. Features
| 1 | Using the advanced technical of DDS; |
| 2 | Using the high speed and advanced microprocessor to design; |
| 3 | Using double channels of AD chip of 16 bits; |
| 4 | With seven inch LCD touch screen of which the brightness can be adjusted; |
| 5 | With thermal printer of which the print thick can be adjusted; |
| 6 | It could store one hundred and twenty groups of data, which could be read to current screen or upload to the PC; |
| 7 | With PC software using which we could upload data ,test, analyze data, print data, or create word document; |
| 8 | Using USB2.0 to connect to the device; |
| 9 | Tester dimension:31cm*15cm*5cm; |
| 10 | Weight:4.0KG |
Two different sweep modes: Linear sweep, Section sweep | ||
| Linear sweep | 0.5KHZ-1MHZinterval 0.5KHZ 2000 dots | |
| Section sweep | 50HZ-100HZinterval 2HZ25 dots | |
| 100HZ-1KHZinterval 20HZ45 dots | ||
| 1KHZ -10KHZinterval 50HZ180 dots | ||
| 10KHZ-100KHZinterval 0.2KHZ 450 dots | ||
| 100KHZ – 500KHZ interval 0.5KHZ 800 dots | ||
| 500KHZ – 1000KHZ interval 1KHZ500 dots | ||
| 2 | Test range | (-100dB) - (+20dB) |
| 3 | Test accuracy | 0.1dB |
| 4 | Frequency accuracy | <0.01% |
| 5 | Signal input impedance | >1M Ω |
| 6 | Signal output impedance | 50 Ω |


